Emergency stop lights Dashboard
Data Viz
Results
Time to First Action improved by 68% First Fixation Time on Problem Area under 2 sec
Link

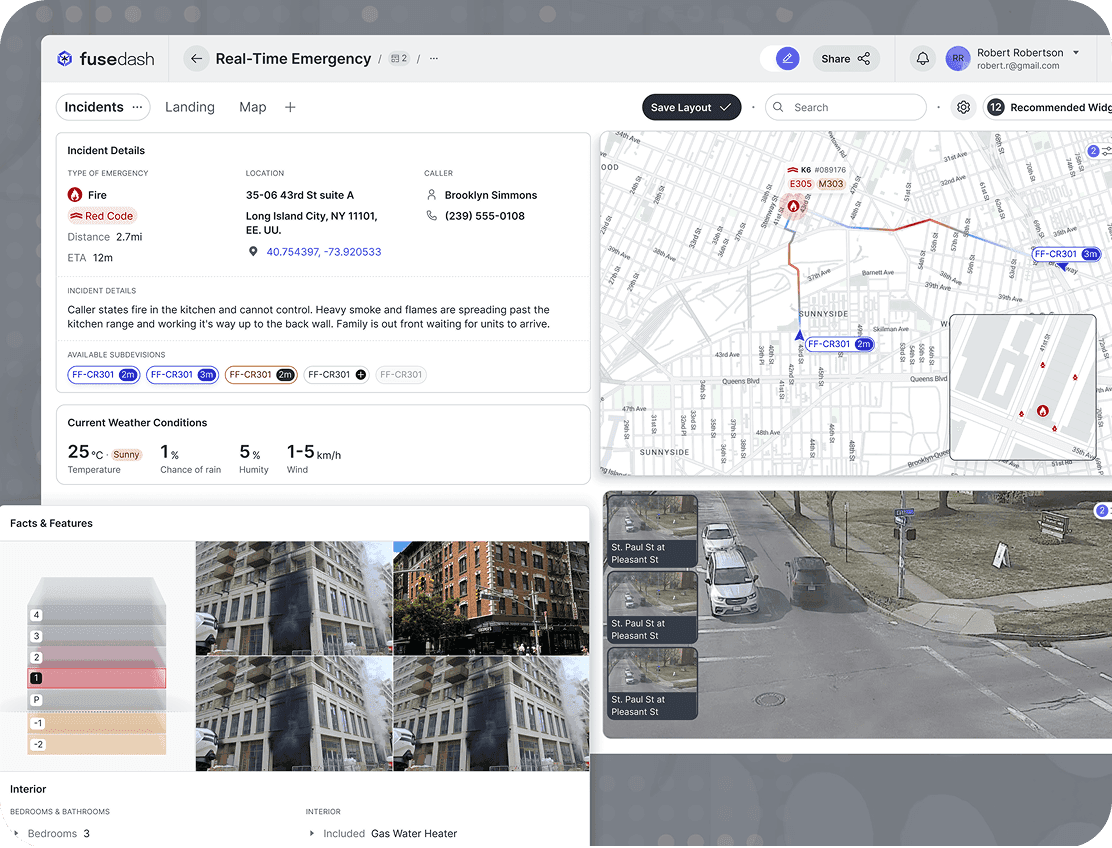
Emergency Stop Lights Dashboard – Reduced Response Time by 67%
Project: Redesign of emergency traffic-light monitoring dashboard
Outcome: Cut operator response time from 12.5 seconds to 4.1 seconds; increased accuracy to 98%
Client: GTT (municipal traffic control)
Role: UX/UI Designer (solo)
Team: Front-end Developer, Traffic Analyst, Project Manager
Duration: 6 weeks
TL;DR
I redesigned a high-pressure emergency response dashboard, reducing Time to First Action by 67% and improving decision-making accuracy from 72% to 98%.
Outcome / Problem Statement
Operators struggled with a cluttered interface and buried alerts, leading to:
Delayed incident responses (average 12.5 seconds)
Frequent errors and misidentification (only 72% accuracy)
Goal: Streamline the UI so operators could identify and act on issues in under 5 seconds—with fewer mistakes.
Users and Needs
Users were emergency responders and operators monitoring critical intersections. They needed:
Immediate visibility into alerts and incidents
Fewer steps to take manual action
A calm, intuitive UI that performs under stress
The existing interface forced them to scan multiple screens, leading to errors and delays.
My Role and Team
I led the UX/UI redesign process, from research to high-fidelity prototypes.
Conducted interviews and usability testing
Created the new information architecture
Designed and tested mid- and high-fidelity mockups in Figma
Collaborated with engineering and domain experts to validate design choices and technical feasibility.
Constraints and Process
Mandate: Reduce response time by 30% within 6 weeks.
Approach:
Conducted stakeholder interviews and heuristic evaluation
Audited the existing UI and benchmarked against best-in-class control systems
Defined a new layout centered around Observe–Act–Log behavior
Built and tested interactive prototypes with six operators
Incorporated feedback and pushed visual refinements for clarity and speed
Design and Iteration Highlights
Information Architecture: Reorganized controls into three main clusters—Observe, Act, Log
Wireframes: Created mid-fidelity layouts in Figma and ran usability tests
Visual Design: Introduced a colorblind-accessible palette, animated flash alerts, and custom iconography
Prototyping: Built high-fidelity views including Map View, Alert Cards, and Analytics Panel
Iterative Feedback: Introduced a collapsible alert drawer after users reported missing lower-priority issues
Results
Metric | Before | After | Change |
|---|---|---|---|
Time to First Action | 12.5 sec | 4.1 sec | -67% |
Identification Accuracy | 72% | 98% | +26 points |
Navigation Steps | 4 clicks | 1–2 | -50–75% |
User Satisfaction (1–5) | 2.3 | 4.6 | +2.3 points |
Error Rate (per week) | 3.4 | 0.6 | -82% |
The redesigned dashboard is live across three city intersections. Operators now report higher confidence and speed: “I trust the system to show me what I need, when I need it.”
Key Takeaways
Clarity and hierarchy are mission-critical in emergency interfaces
Progressive disclosure helped reduce cognitive load without sacrificing visibility
Iterative testing with real users surfaced edge cases early
Next Steps
Extend the interface for use on tablets in field vehicles
Prototype voice-enabled controls for hands-free operation
Integrate predictive routing tools to anticipate traffic conflict points